How Power BI Supports HR Analytics for Decision-Making
Discover how Power BI supports HR analytics by transforming workforce data into insights for better HR decisions and planning.
 Aiswarya N
Human resource teams work with different types of information, including employee attendance, recruitment records, training results, performance details, and workforce data. However, collecting this information is only the first step. HR professionals also need to identify patterns and understand what the data reveals before making decisions.
This is where data visualisation tools become useful. Microsoft Power BI helps HR teams organise information, create interactive dashboards, and present workforce trends through easy-to-understand reports. It allows managers to review important details without manually checking multiple spreadsheets.
In this guide, we will explore how Power BI supports HR analytics and helps HR professionals make informed, data-driven decisions.
What is Power BI in HR Analytics
Power BI is a business intelligence and data visualisation platform developed by Microsoft. It allows users to connect information from sources such as Excel files, databases, and other business applications. Users can organise this information and present it through charts, reports, and interactive dashboards.
Power BI for HR analytics helps professionals bring different types of workforce information together. For example, an HR team can combine employee records, attendance details, and training data to create a dashboard showing important workforce trends. When combined with AI in HR analytics, these insights can also support deeper analysis of workforce patterns and help identify areas that may need attention.
Instead of reviewing separate spreadsheets, managers can access relevant information through a single report. They can also use filters to examine specific departments, employee groups, or time periods.
Why is Data-Driven Decision-Making Important in HR
HR decisions influence recruitment, employee development, workforce costs, and daily business operations. Relying only on assumptions can make it difficult to identify the actual reasons behind workforce challenges.
For example, if a department experiences frequent employee exits, HR professionals need to examine possible reasons, such as workload, management practices, or employee satisfaction. Analysing relevant information can help them investigate these patterns before deciding what action to take.
The growing importance of workforce information is also reflected in market estimates. Grand View Research valued the global HR Analytics market at USD 5.3 billion in 2026 and expected to reach USD 12.5 billion by 2033, representing a CAGR of 13.0% between 2026 and 2033. North America accounted for 34.5% of the global market in 2025. These figures reflect the increasing demand for solutions that help organisations use employee information, manage operational expenses, and understand workforce behaviour.
Read More:
- Cybersecurity Considerations for Business Analysts
- How Business Analysts Drive Digital Transformation
- Bridging the Gap Between IT & Business as a Business Analyst
How Power BI Supports HR Analytics for Decision-Making
Here are 6 practical ways Power BI for HR analytics can help organisations examine employee information and make better-informed decisions:
1. Understanding Employee Turnover Patterns
Employee turnover refers to the number of employees leaving an organisation during a particular period. Power BI can display exit records through charts and reports that compare turnover across departments, job roles, and time periods.
For example, if one department has a higher employee exit rate than others, HR teams can investigate the possible reasons. They may review exit feedback, employee tenure, and workload information to understand the situation.
These findings can help managers identify areas that require attention and consider suitable employee retention measures. While analysing such information, organisations should also follow the ethics of HR analytics by protecting employee privacy and using workforce data responsibly.
2. Monitoring Employee Attendance and Absenteeism
Attendance information helps organisations understand employee availability and identify recurring absence patterns.
Using Power BI for HR analytics, HR professionals can compare attendance across departments and examine changes over different months. A dashboard may reveal higher absenteeism in a particular team or during certain periods.
This information does not automatically explain why employees are absent. However, it helps HR teams identify patterns that may require further investigation and supports better workforce scheduling.
3. Analysing Recruitment Performance
Recruitment involves several activities, from receiving applications to conducting interviews and selecting suitable candidates. Power BI can help HR teams monitor these activities and understand how efficiently the hiring process is progressing.
A recruitment dashboard can display:
- Number of applications received.
- Candidates shortlisted for interviews.
- Time taken to fill open positions.
- Recruitment sources used by the organisation.
- Progress of candidates through different hiring stages.
Mordor Intelligence's market estimates indicate that talent acquisition and onboarding represented 28.74% of the HR Analytics market by application. This highlights the importance of recruitment-related data in HR analytics. By reviewing hiring metrics, organisations can identify delays, compare recruitment channels, and understand where improvements may be needed.
4. Evaluating Employee Training and Development
Organisations invest in employee training to improve workplace knowledge and develop relevant skills. However, HR teams also need to evaluate whether these programmes are achieving their intended objectives.
Power BI for HR analytics can present information such as training participation, course completion, and assessment results. HR professionals can compare these details across departments and employee groups.
For example, if employees in one department have lower training completion rates, the team can investigate whether scheduling difficulties, workload, or other factors are affecting participation.
Training dashboards can also help managers identify areas where additional learning support may be useful.
5. Understanding Workforce Distribution
Workforce distribution shows how employees are allocated across departments, job roles, locations, and experience levels. Understanding this information helps organisations identify staffing gaps and plan their resources more effectively.
Power BI dashboards can make workforce details easier to compare. HR managers can review department-wise headcount, identify teams with higher staffing requirements, and examine how employee resources are distributed.
This is particularly relevant because Grand View Research identified workforce planning as the leading solution segment in the HR Analytics market, accounting for 28.8% of revenue in 2025. This market trend reflects the importance organisations place on understanding staffing requirements and planning their workforce.
Mordor Intelligence also estimates that large enterprises accounted for 62.33% of the HR Analytics market by organisation size in 2025. However, small and medium-sized businesses are expected to experience faster growth, with a projected CAGR of 13.92% through 2031. This suggests that workforce analytics is becoming relevant to organisations of different sizes.
6. Tracking Employee Performance Metrics
Performance information helps managers understand how employees and teams are progressing towards their work objectives.
With Power BI for HR analytics, organisations can present performance-related information through visual reports and compare trends across review periods. Managers can use these reports to identify areas where employees may need additional guidance, resources, or development support.
However, performance dashboards should be interpreted alongside employee responsibilities, working conditions, and other relevant factors. Numerical results alone cannot explain every aspect of an individual's performance.
Read More:
- How to become a Business Analyst in India
- Business Analytics Scope in India
- How to Become a Business Analytics Expert in India
Important HR Metrics to Track Using Power BI
The metrics included in an HR dashboard should match the organisation's objectives. Some commonly used measures include:
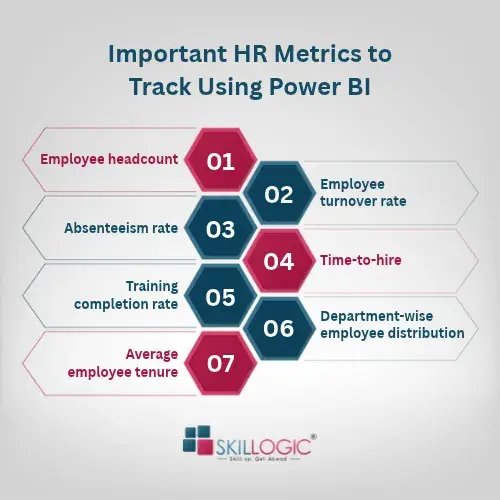
- Employee headcount: Total number of employees in the organisation.
- Employee turnover rate: Percentage of employees who leave during a specific period.
- Absenteeism rate: Measures employee absence in relation to available working time.
- Time-to-hire: Time taken to complete the recruitment process.
- Training completion rate: Percentage of employees who complete assigned training.
- Department-wise employee distribution: Shows how employees are allocated across departments.
- Average employee tenure: Indicates how long employees have worked for the organisation on average.
Power BI can bring these measures together in a single dashboard, allowing HR professionals to compare results, monitor changes, and identify areas that may require further investigation. Tracking the right metrics also helps managers evaluate workforce requirements and make decisions based on measurable information.
Microsoft Power BI has also received recognition in the business intelligence industry. Microsoft announced that it was named a Leader in the 2026 Gartner Magic Quadrant for Analytics and Business Intelligence Platforms for the 19th consecutive year. The Power BI platform was also reported to have more than 35 million monthly active users. This provides additional context for its widespread use as a business intelligence tool.
In short, Power BI helps HR teams move beyond manually reviewing employee records and present workforce information in a clearer, more organised way. When combined with accurate data and proper interpretation, it can support decisions related to recruitment, attendance, employee development, and workforce planning. The real value of a dashboard depends on how effectively HR professionals use the information to understand workplace needs and take appropriate action.
With a focus on industry-relevant professional education, SKILLOGIC brings 13 years of training experience and has supported more than 2,00,000 learners globally. Recognised by Silicon India, the institute holds over 25 accreditations and industry partnerships, including IABAC, PEOPLECERT, PMI, and ICFQ. The SKILLOGIC offers AI-Powered HR Analytics Course, accredited by IABAC, helps learners understand how data analytics can be applied to human resource management. The programme covers workforce data analysis, HR metrics, employee performance evaluation, and practical analytical methods. Through 2 months of structured training and practical lab access, participants develop an understanding of how data can support recruitment, employee management, and workforce planning. Those looking for a top HR analytics certification course can explore this programme to build relevant analytical skills. It also includes an internship certificate.